


Here's an uncomfortable truth about markets: they're often most convincing right when the risk is shifting. Breakouts get attention, validate the prevailing story, and pull in fresh capital. But when those breakouts fail—especially inside expanding volatility structures—they tend to reveal something more important than whether the trend continues. They show you who actually controls the liquidity.
That's where the Nasdaq (NDAQ) complex finds itself right now.
Despite a still-intact bullish weekly trend in the Nasdaq Composite (IXIC) and Nasdaq-100 (NDX), recent price action in their ETF counterparts—ONEQ and QQQ—has taken on distinctly late-cycle characteristics. A failed breakout above a broadening formation, combined with persistent momentum divergence, suggests that upside strength is increasingly being used for distribution rather than accumulation. This places the market at a genuine decision point, one where follow-through matters more than the narrative everyone's been telling themselves.
Broadening Formations and Volatility Expansion: The Structural Backdrop
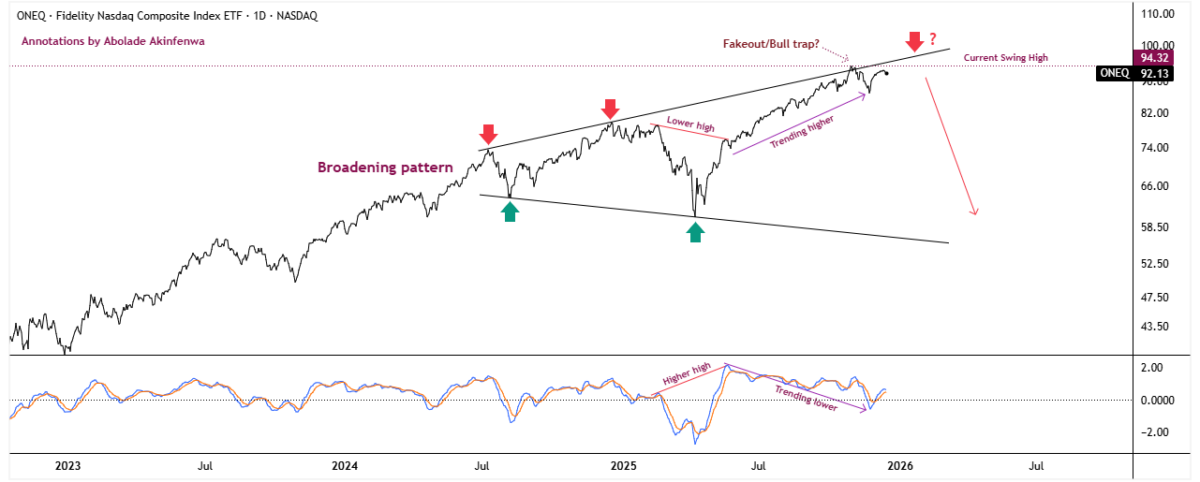
On the daily chart, both the Nasdaq Composite and its broad-market ETF proxy ONEQ continue to trade within well-defined broadening formations, marked by higher highs and lower lows. Unlike compression patterns that typically precede durable breakouts, broadening structures reflect growing disagreement among market participants and a steady expansion in volatility. These are conditions commonly observed late in trend cycles, not early ones.
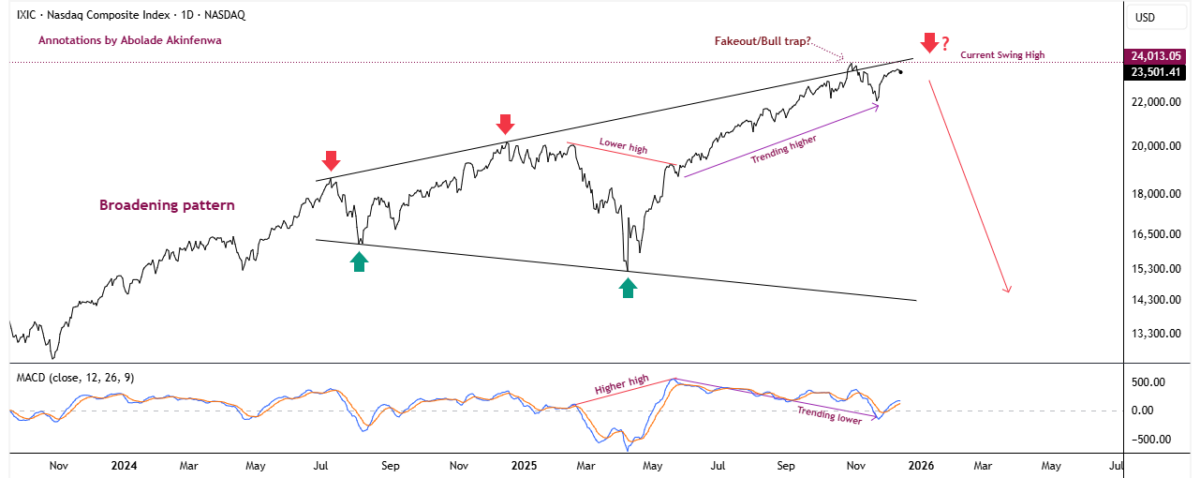
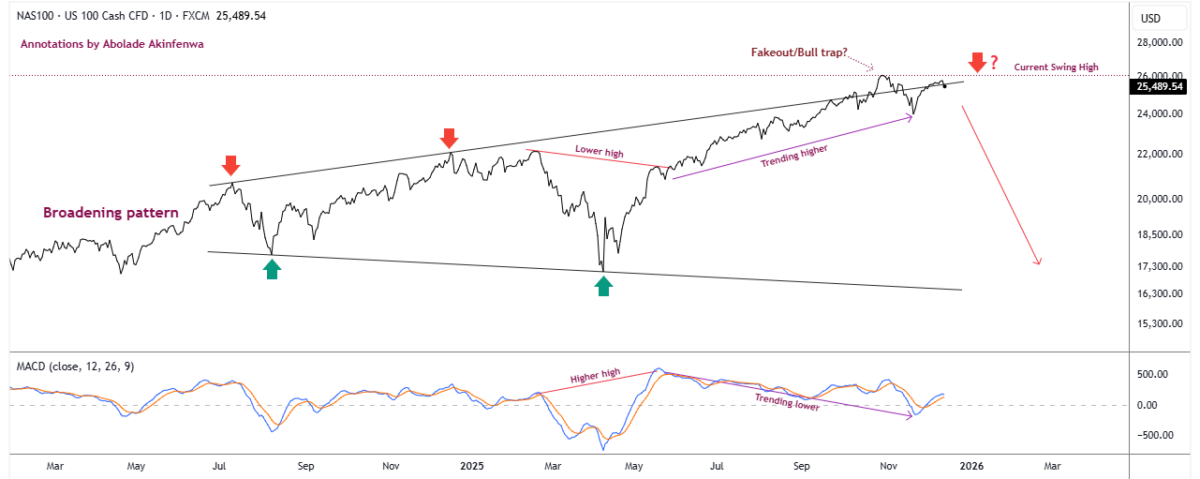
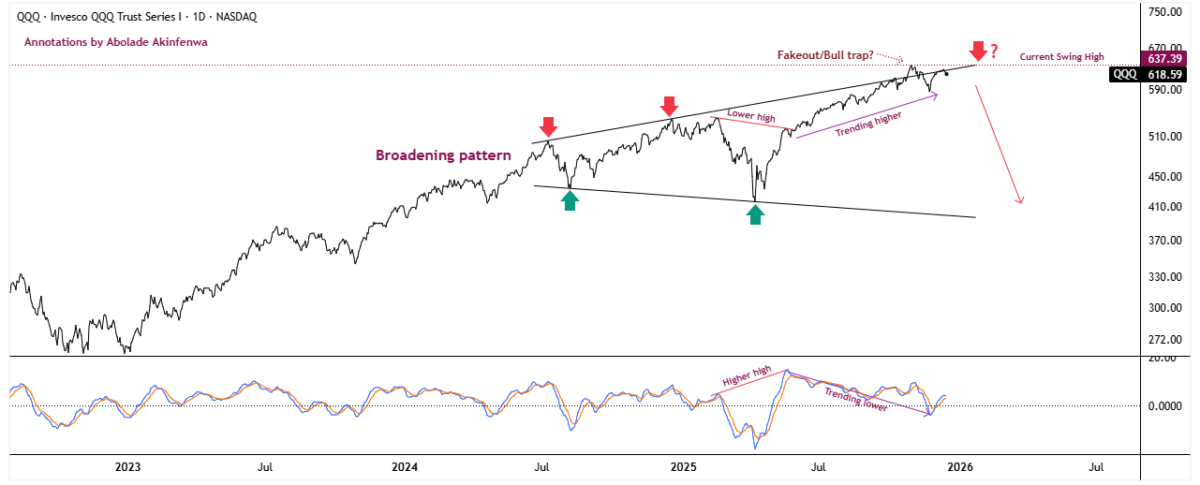
What's crucial here is that price recently broke above the upper boundary of these formations, only to fail and re-enter the range from above. The same behavior showed up in the Nasdaq-100 and QQQ, where leadership, leverage, and derivatives exposure are concentrated. Failure at the upper boundary in these instruments is especially meaningful because it suggests that the market's most influential components are struggling to sustain upside even as broader participation follows along.
Failed breakouts above broadening tops are statistically associated with liquidity harvesting, where late buyers get absorbed by supply rather than rewarded with sustained follow-through.
This isn't neutral behavior. It's a regime tell.
Daily Momentum: Distribution Revealed Where Leadership Matters Most
Momentum confirms what structure implies.
On the daily timeframe, NDX and QQQ—the leadership and flow-sensitive components of the Nasdaq—continue to display persistent bearish divergence, with price grinding higher while MACD trends lower following an earlier hidden bearish divergence that signaled supply never fully exited the market. Together, these signals suggest deteriorating demand beneath the surface of continued price strength.
IXIC and ONEQ echo the same message, but it's the behavior in QQQ that carries greater weight. As the primary vehicle for options flow, passive exposure, and systematic hedging, weakening momentum in QQQ during breakout attempts tends to quickly propagate risk across the broader Nasdaq complex rather than remain isolated.
The recent MACD golden cross explains short-term stabilization and why downside hasn't accelerated yet. However, it hasn't produced a higher momentum peak, nor has it coincided with volatility compression. In late-cycle environments, these counter-trend momentum rebounds often occur inside distribution phases, allowing price to drift higher even as participation deteriorates.
In other words, the market is still moving, but it's moving on diminishing fuel.
Weekly Momentum: Why the Trend Hasn't Broken (Yet)
Zooming out, the weekly charts of IXIC, NDX, ONEQ, and QQQ provide essential context and the source of confusion for many market participants.
Across all four, the primary weekly trend remains up, reinforced by hidden bullish divergences. These signals support trend continuation attempts, not trend safety. They explain why downside has been delayed and why bearish narratives have repeatedly failed to gain traction, even as lower-timeframe conditions have deteriorated.
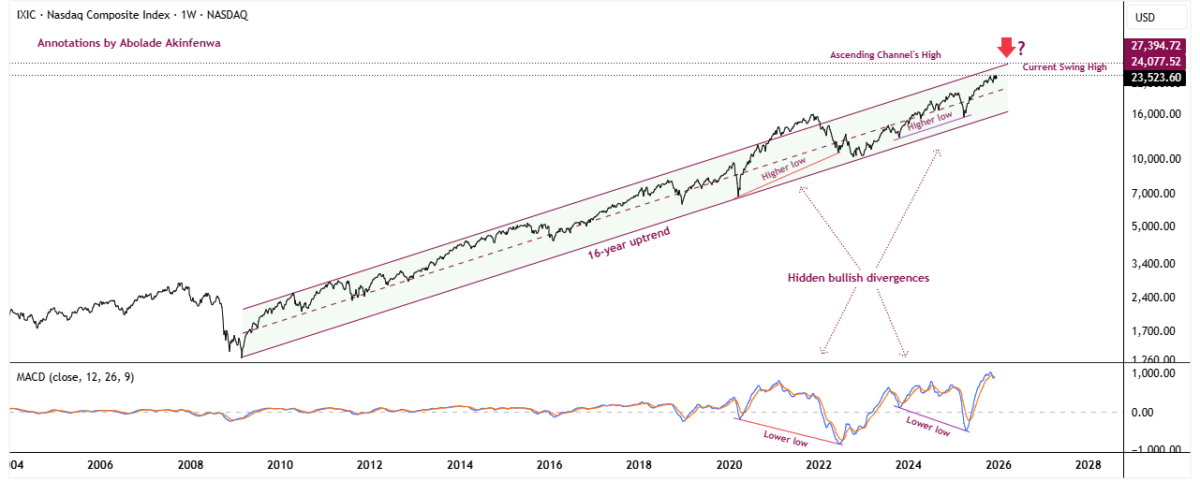
But this is precisely how late-cycle distribution often unfolds: higher-timeframe trends remain intact while lower-timeframe structures weaken first, creating a growing disconnect between price persistence and underlying risk.
The weekly charts tell us the market hasn't transitioned into a bear trend yet.
The daily charts tell us that risk is rising within that trend.
Both statements can be true simultaneously.
The Index and ETF Cross-Check: Where the Stress Is Concentrated
This is where the market signal sharpens, in the growing divergence between leadership and breadth.
NDX and QQQ (leadership and flow) are already pressed against the upper boundary of their broadening formations, where failed breakouts carry the greatest consequence due to their influence on options positioning, passive exposure, and systematic hedging.
IXIC and ONEQ (breadth) retain marginal headroom, but they're operating within the same structural regime and are unlikely to decouple if leadership fails.
This leader-laggard configuration is typical of late-cycle environments: distribution begins in concentrated leadership and derivatives-heavy vehicles, then bleeds outward into broader participation.
The failed breakout in QQQ matters more than a similar move in IXIC, not because breadth is irrelevant, but because leadership decides first.
Bull Trap Anatomy: Why the Failed Breakout Matters
Putting structure and momentum together across indexes and ETFs, the recent price action fits the definition of a bull trap:
- A breakout above widely observed resistance across IXIC, NDX, ONEQ, and QQQ, drawing in late-stage buyers
- Momentum failing to confirm, particularly in leadership (NDX and QQQ), where sustained upside participation matters most
- Immediate re-entry into the prior range, signaling that supply absorbed the breakout attempt
- Occurring within an expanding-volatility, late-cycle environment, where false signals are more common than clean continuation
This doesn't imply an imminent crash. But it does suggest that recent upside attempts are increasingly serving as liquidity events, transferring inventory from informed sellers to reactive buyers rather than building sustainable trend extension.
Until proven otherwise, rallies near the upper boundary of these broadening formations should be treated as risk, not opportunity.
What Would Change the Distribution Risk Thesis
For this environment to transition from distribution risk to renewed continuation, the market must prove that the recent bull trap has been invalidated across both leadership and breadth:
- A sustained breakout above the current swing highs, held for a meaningful period rather than a brief or intraday push
- Momentum confirmation, including a higher MACD peak in NDX and QQQ, signaling renewed participation in leadership
- Volatility compression, indicating a shift away from the current expansion regime toward trend stability
Absent these conditions, the burden of proof remains on the bulls.
The Bottom Line
The Nasdaq isn't collapsing, but it's no longer behaving like a healthy, early-cycle advance. A bullish weekly trend across IXIC, NDX, ONEQ, and QQQ is masking daily-chart distribution, now exposed by a failed breakout that qualifies as a bull trap. With momentum diverging and volatility expanding, especially in leadership, upside strength increasingly looks like liquidity harvesting rather than trend continuation.
This is what a decision point looks like.
And until confirmation arrives, risk, not reward, deserves the greater weight in positioning and expectations.